From a static report to a platform that won its funding.
Designing GAP IQ — a clickable prototype that showed how Virginia Tech’s Global Agricultural Productivity Report could become a self-serve data platform for policymakers, investors and researchers.
- Client
- Virginia Tech · Google Public Sector
- Product
- GAP IQ agricultural data platform
- My role
- Head of Design
- Scope
- Prototype, technical assessment & roadmap
- Platform
- Google Looker & BigQuery
The challenge
The GAP Report tracked high-level trends, but its static format made the insights hard to apply — and the data lived in disparate sources.
The mandate
Show what a modern platform could be: interactive, localized and up to date, with real-time intelligence for precise decisions in agricultural development.
The outcome
A clickable prototype and roadmap that helped Virginia Tech secure funding for the full platform, which launched in October 2026 as GAP IQ, free and open to all.
01
Context
Virginia Tech’s College of Agriculture and Life Sciences publishes the Global Agricultural Productivity (GAP) Report, a reference for policymakers, investors and researchers working on agricultural development.
The report tracked high-level trends, but as a static document it was hard to apply to a specific country, policy or investment. The college wanted to digitize it: integrate disparate datasets, add real-time intelligence and make the insights interactive.
02
Key decisions
Prototype the platform before building it
The call
A clickable demo of a self-serve data platform, so stakeholders could experience the vision rather than read about it.
The payoff
A tangible proof point to take to funders.
Design on a real data stack
The call
Build the experience around Google’s Looker and BigQuery.
Feasibility
In-depth technical assessments to make sure the platform could scale.
Map the route from report to platform
The call
A strategic roadmap for integrating disparate data sources into one unified, dynamic dashboard.
The detail
The steps to move from a static report to an interactive data ecosystem.
03
Designing GAP IQ
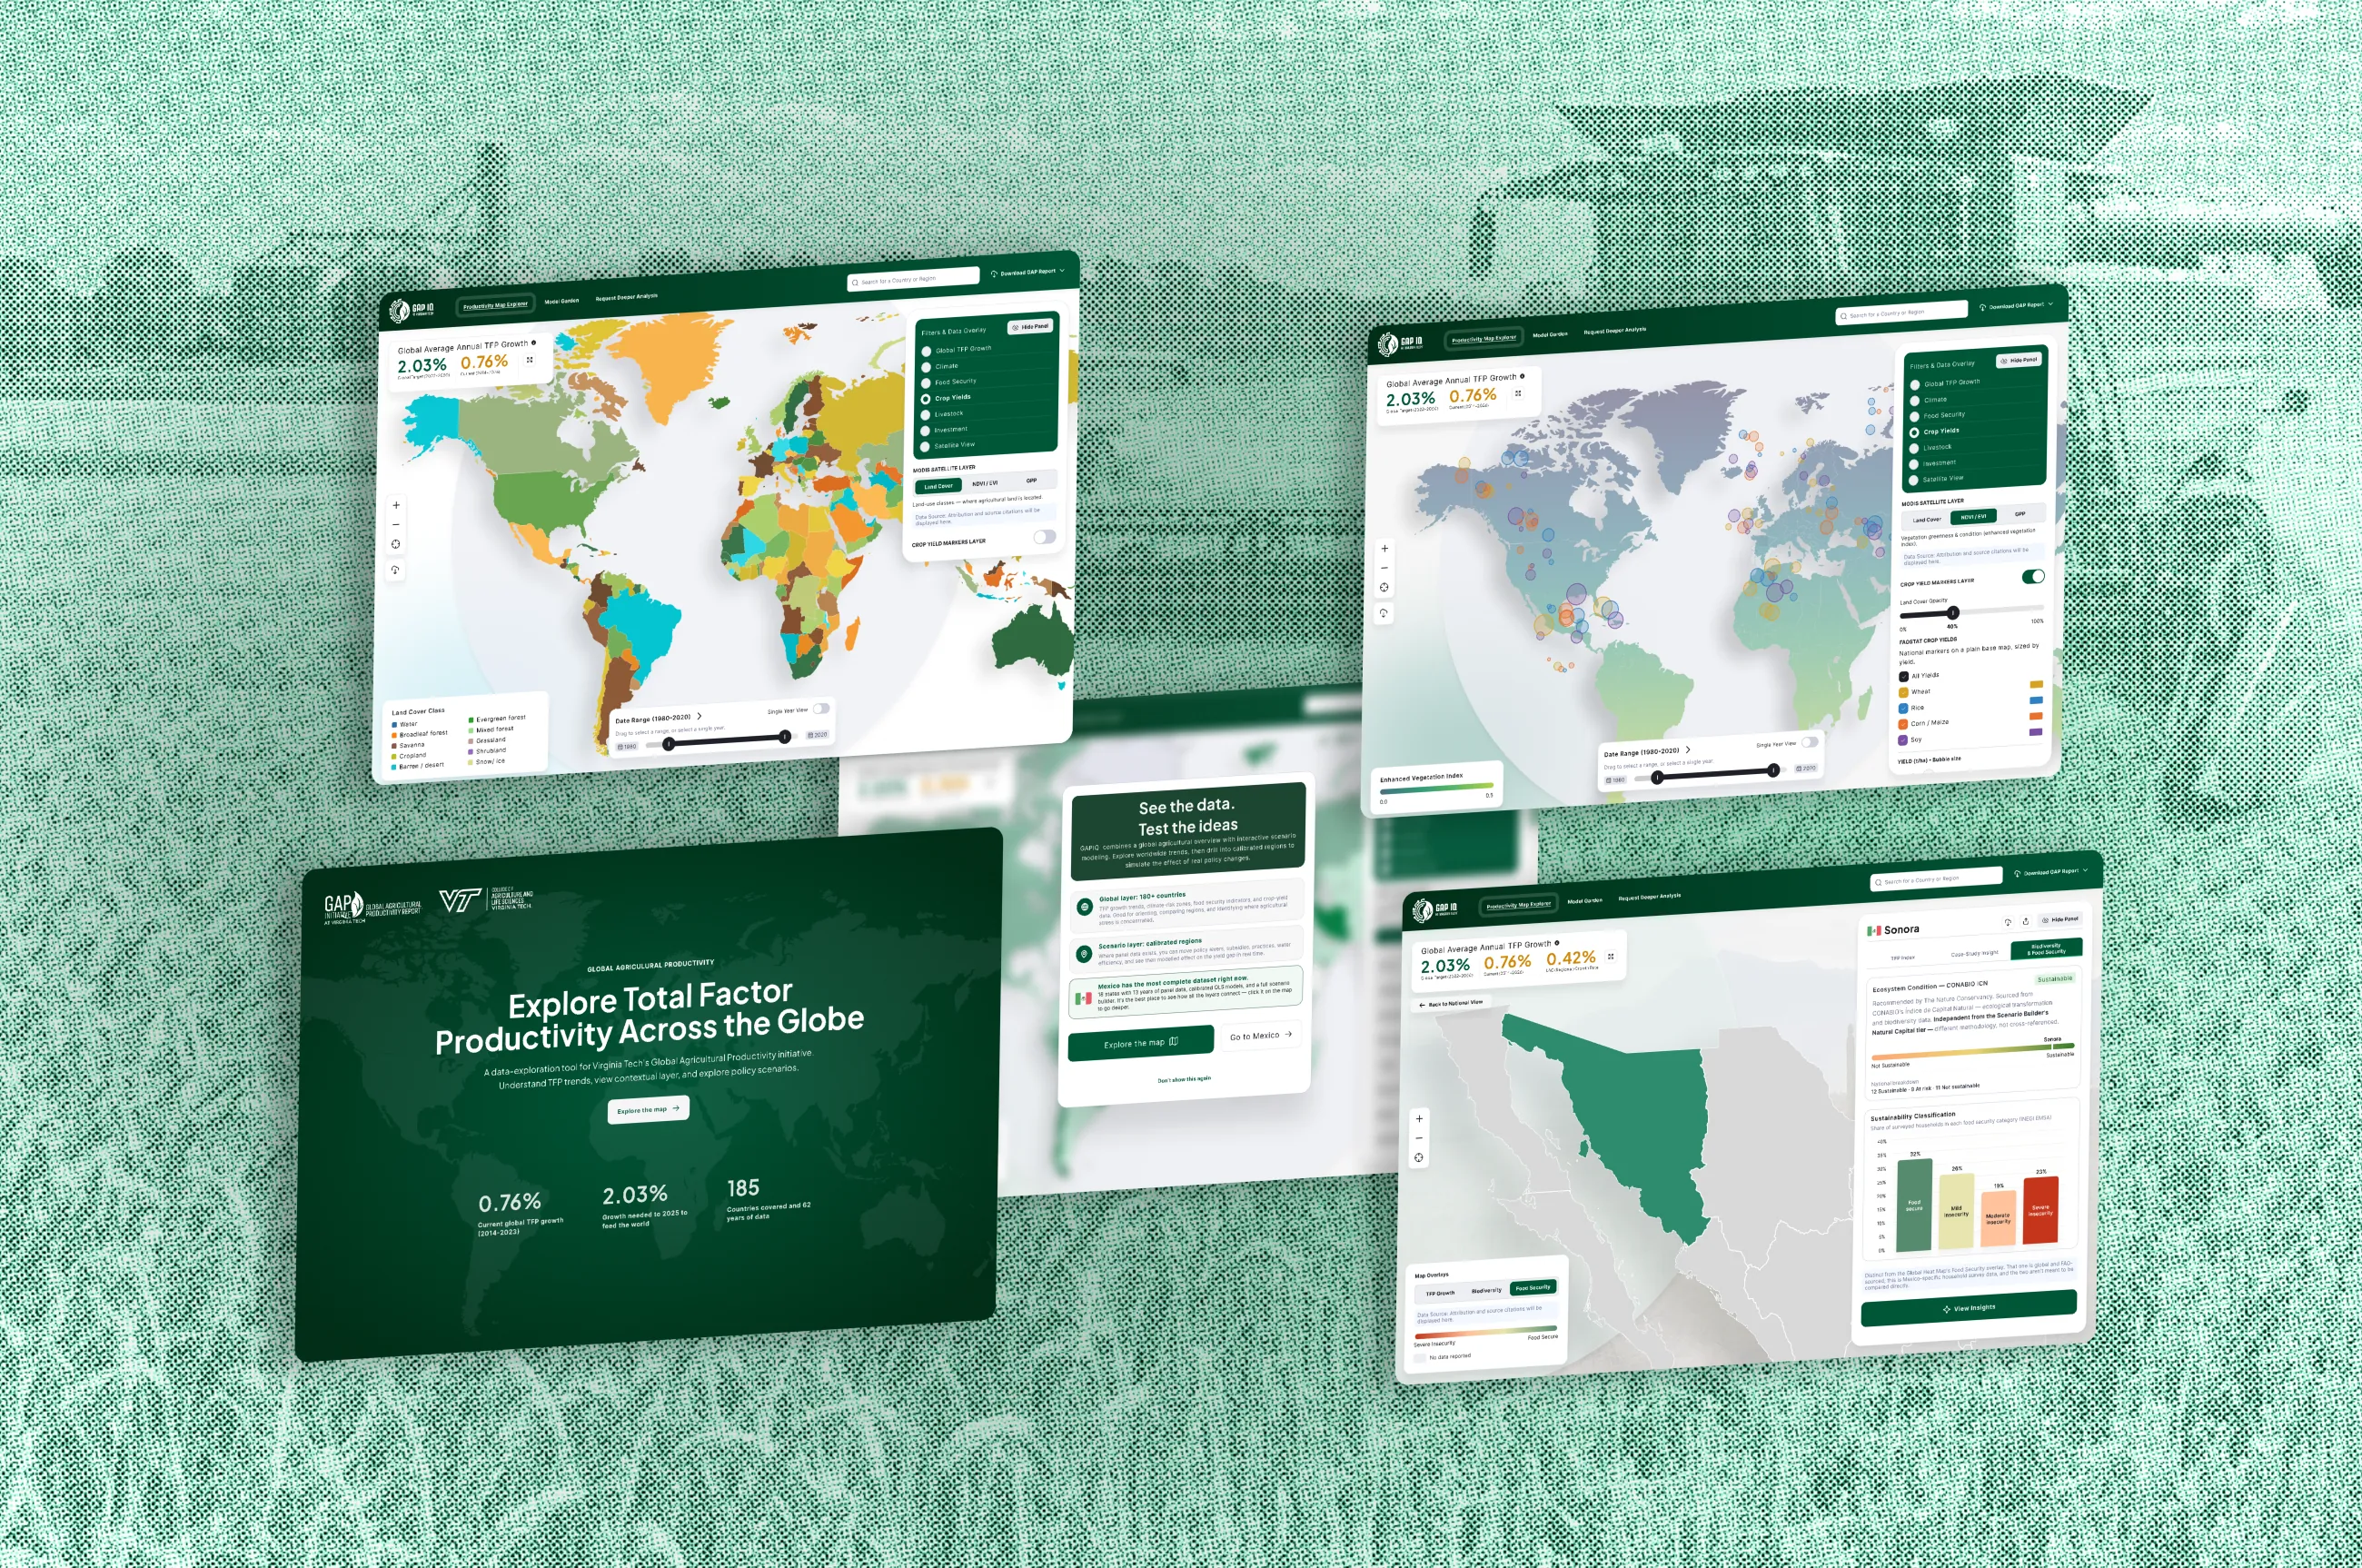
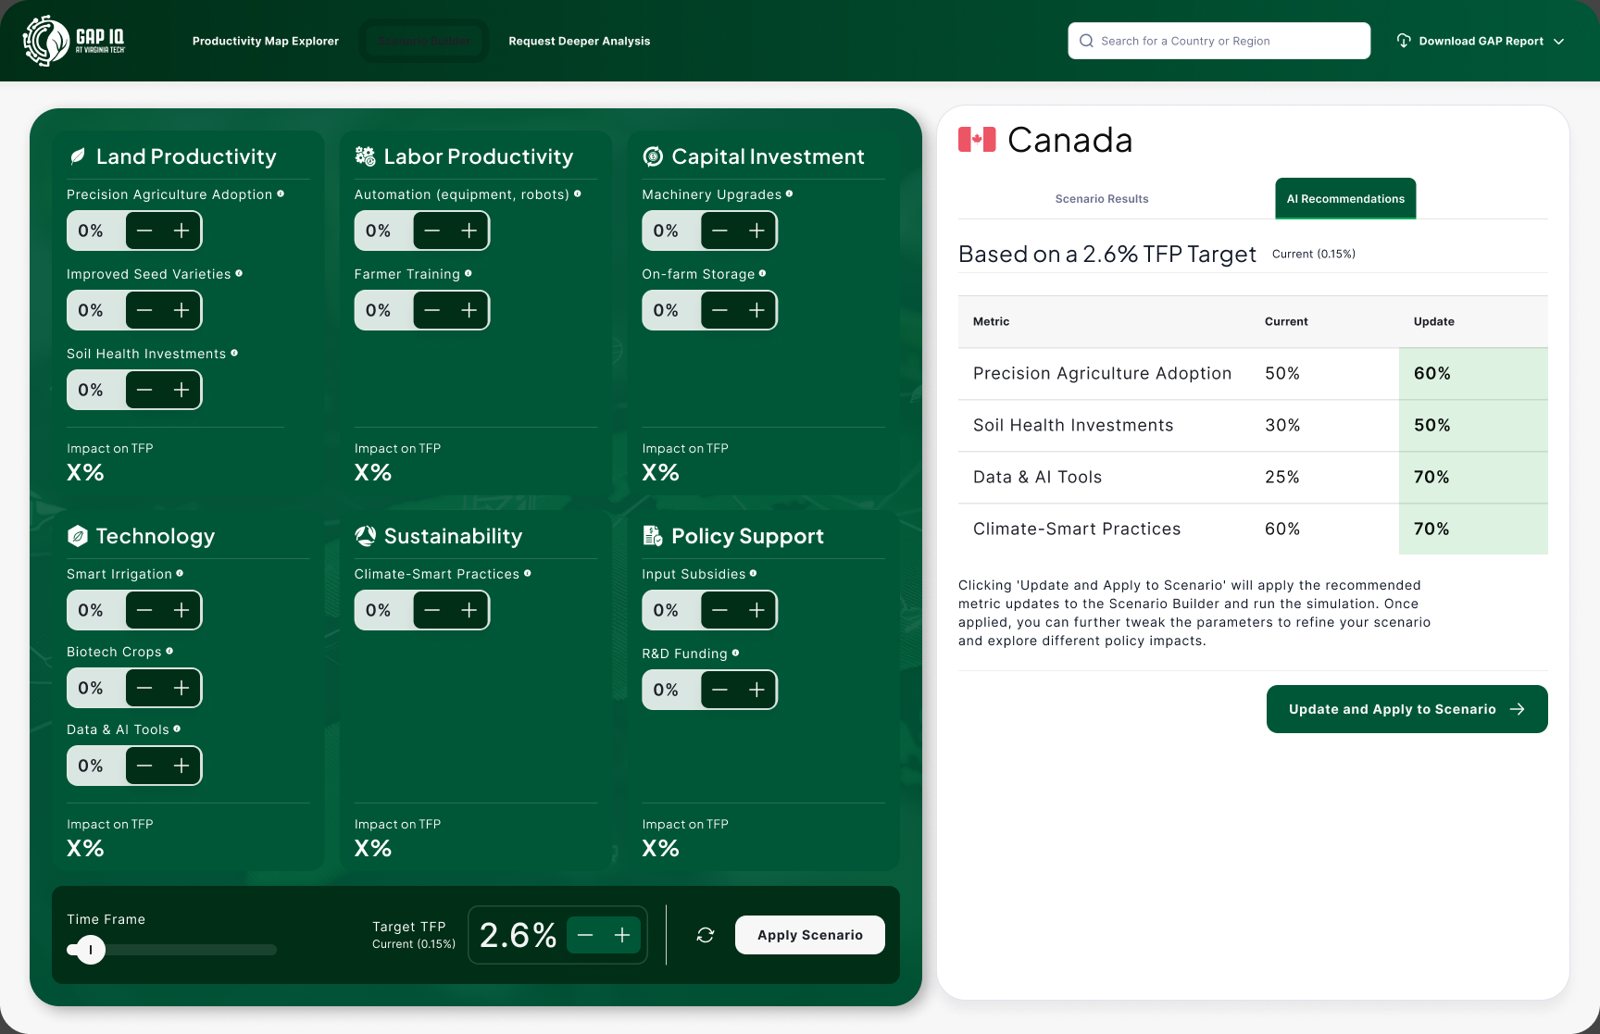
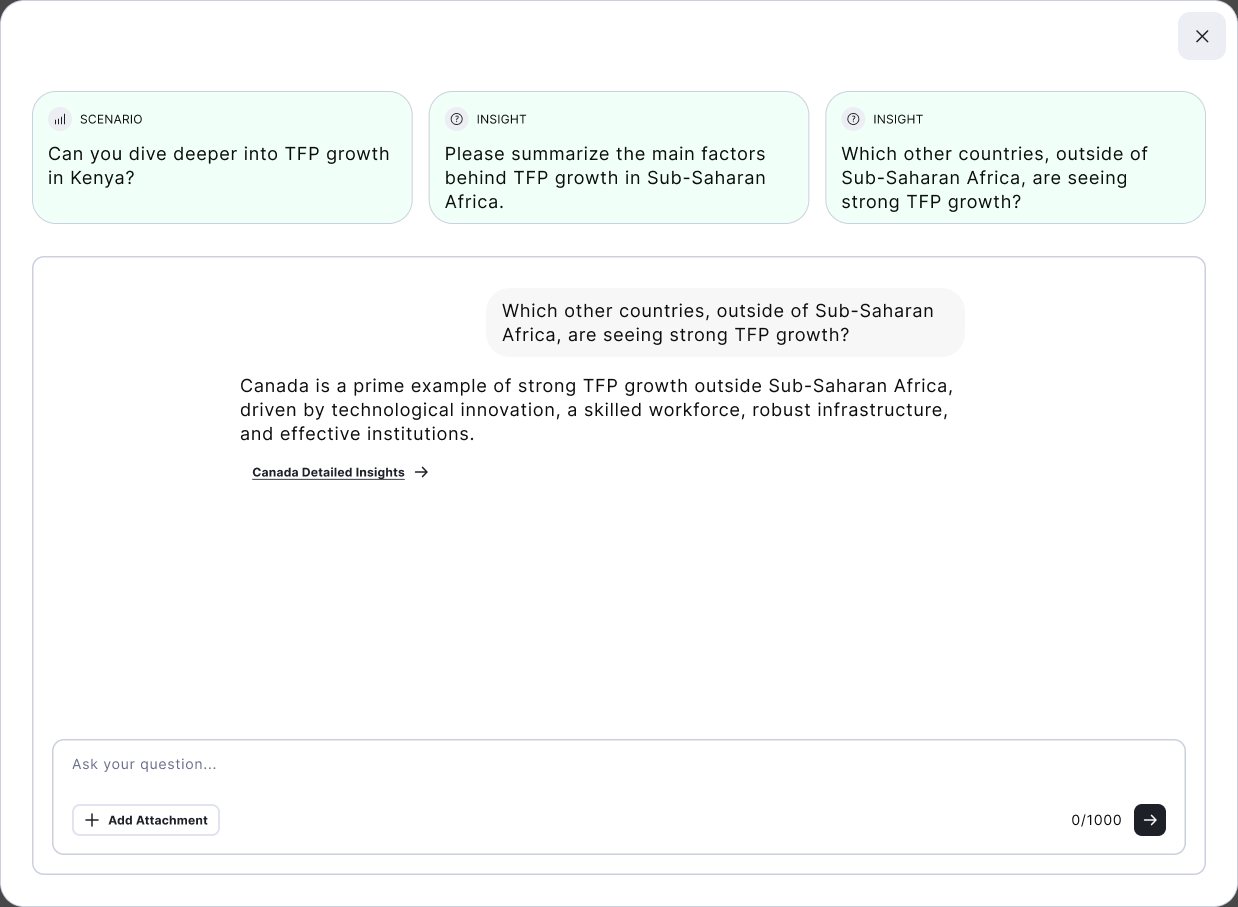
Interactive exploration, real-time scenario modelling and AI-driven predictive analytics, so users can drill down into the metrics that matter to them.
- 01Explore the map
- 02Drill into a country
- 03Model a scenario
04
The team
Design and technical assessment ran side by side, so the demo stayed grounded in what Looker and BigQuery could deliver. I started with senior leadership at Virginia Tech and Google Public Sector, setting how we’d work and introducing my team to theirs. From there, Alex, our senior manager, led design with Vanessa, our senior designer. The team met twice a week and reported to me weekly.
- Product designAlex Iannantuono, Vanessa Miura
- Front-end engineeringAlan Lyes, Jean Oliveira, Pipo Bizelli, Gary Hetherington
05
Outcomes
Live in October 2026
GAP IQ launched alongside the 2026 GAP Report: open access, and free for users worldwide.
Funding secured
The prototype helped Virginia Tech secure funding for the full platform, backed by an investment from the College of Agriculture and Life Sciences.
A first investor
The Nature Conservancy became the first investor in customized work, funding a pilot on agricultural support payments, natural capital and productivity.
Six decades in one place
A productivity map explorer to compare countries and regions, build visualizations and download six decades of global agricultural data.
“It has the potential to become a powerful decision-support tool.”
06
Reflection
Not every client arrives ready to invest in proper software. Part of the job is education, and education needs proof points. More often than not, the proof point is a rapid prototype: something real enough to show what taking the time to build properly will return against the client’s goals.
GAP IQ is a clear example of that working. The prototype won the investment for the full platform, and it grew into an ongoing relationship with Virginia Tech and Google’s public sector team, developing the product into a tool for economic viability that helps demystify the data behind global agriculture and food systems policy.